| 2018 SAR million |
2017
SAR million |
|
| Total income* | 2,839 | 2,792 |
| Total expense** | 1,133 | 1,059 |
| Operating profit | 1,706 | 1,733 |
| Impairment charges | 247 | 332 |
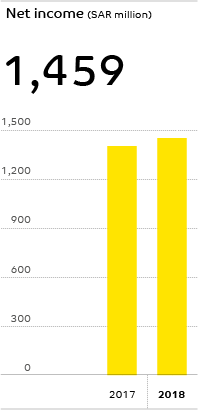
| Net income | 1,459 | 1,411 |
| Loans and advances, net | 59,413 | 59,588 |
| Investments, net | 24,638 | 21,714 |
| Investments in associates | 1,012 | 1,020 |
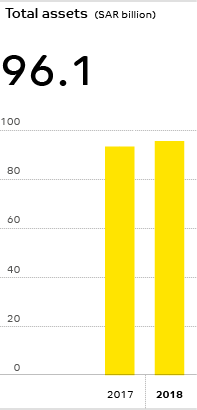
| Total assets | 96,070 | 93,796 |
| Term loans | 2,030 | 2,015 |
| Subordinated debt | 2,006 | 2,003 |
| Customer deposits | 63,690 | 66,943 |
| Shareholders’ equity | 11,654 | 13,494 |
| Tier I Sukuk | 1,785 | 785 |
| Total equity | 13,439 | 14,279 |
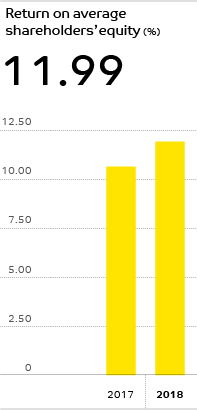
| Return on average equity % | 11.99 | 10.72 |
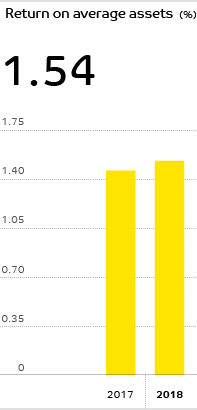
| Return on average assets % | 1.54 | 1.51 |
| Capital adequacy % | 19.36 | 20.38 |
| Equity to total assets % | 13.99 | 15.22 |
* Total income includes total operating income plus share in earnings of associates.
** Total expense includes total operating expenses before impairment charges.
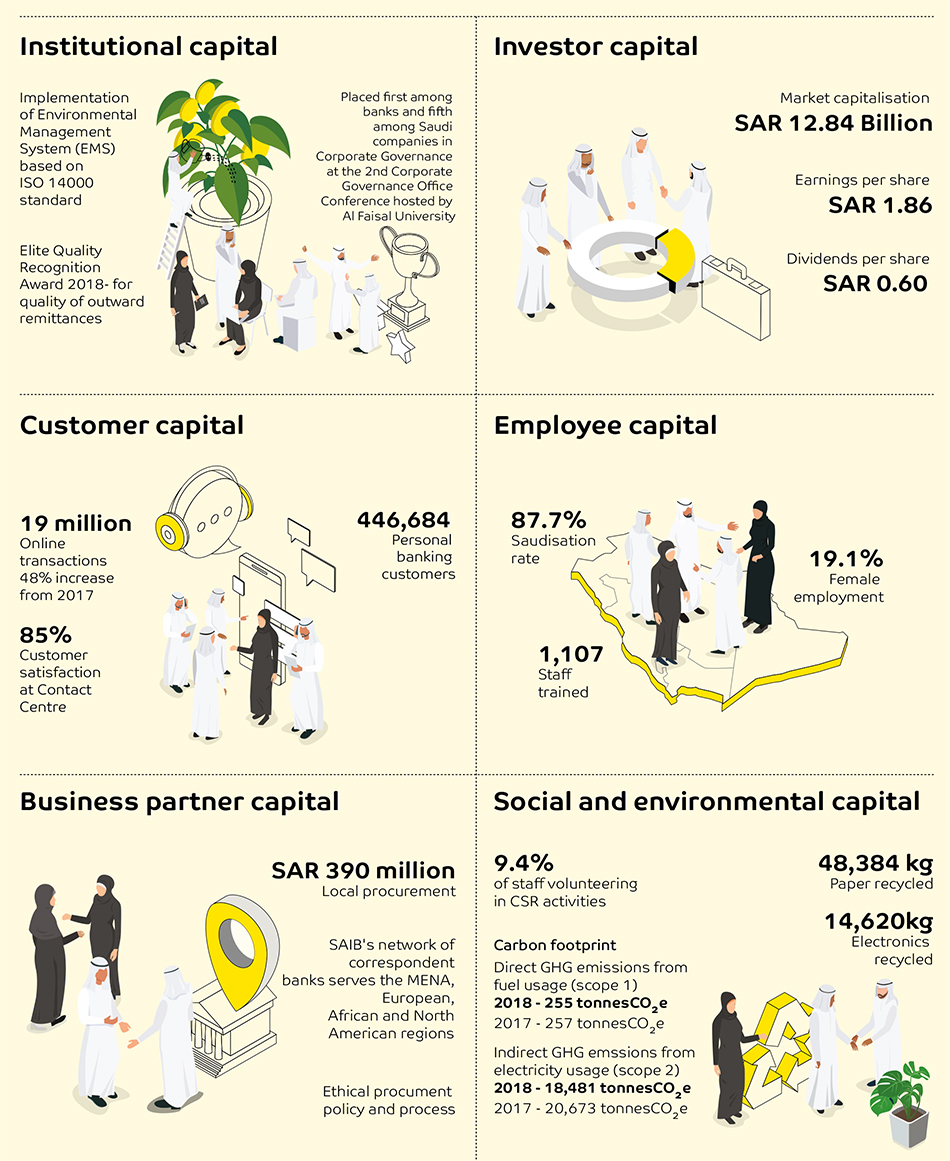
| GRI 102-7, 305-1, 305-2 |